
WBS Generator
Create a work breakdown structure for your project.
Streamline your projects with easy-to-use tools.
Create a work breakdown structure for your project.
Calculate complex activity dependencies.
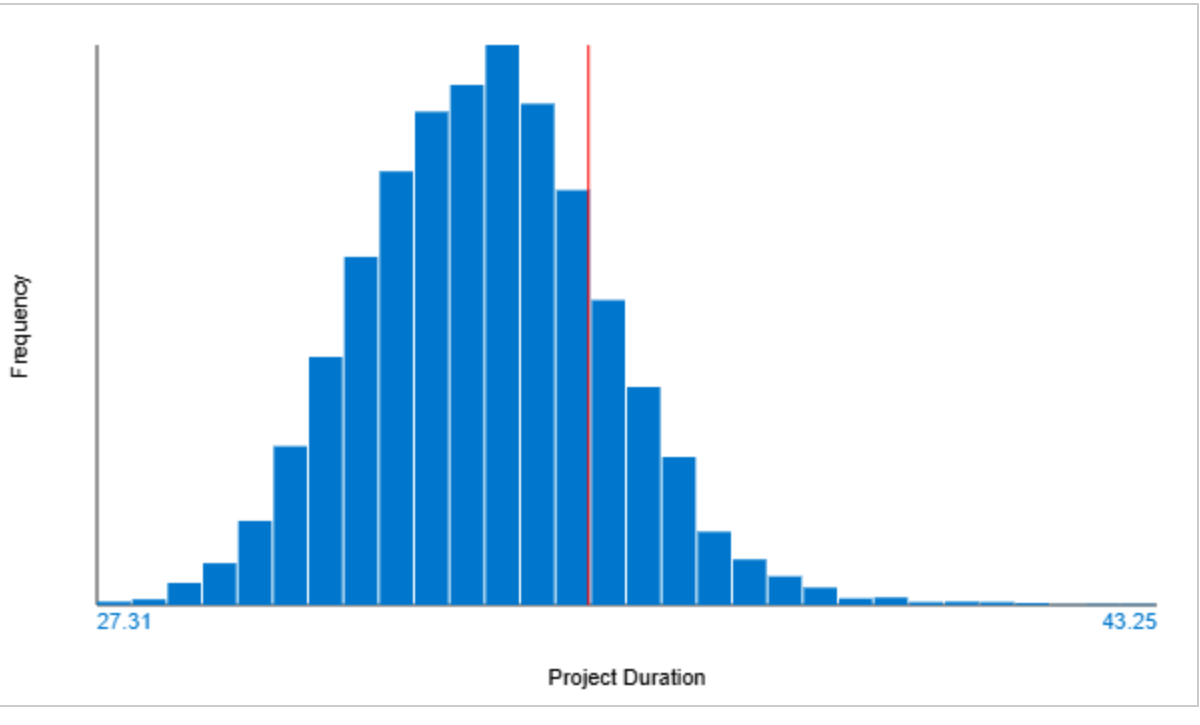
Simulate interdependencies using Monte Carlo.
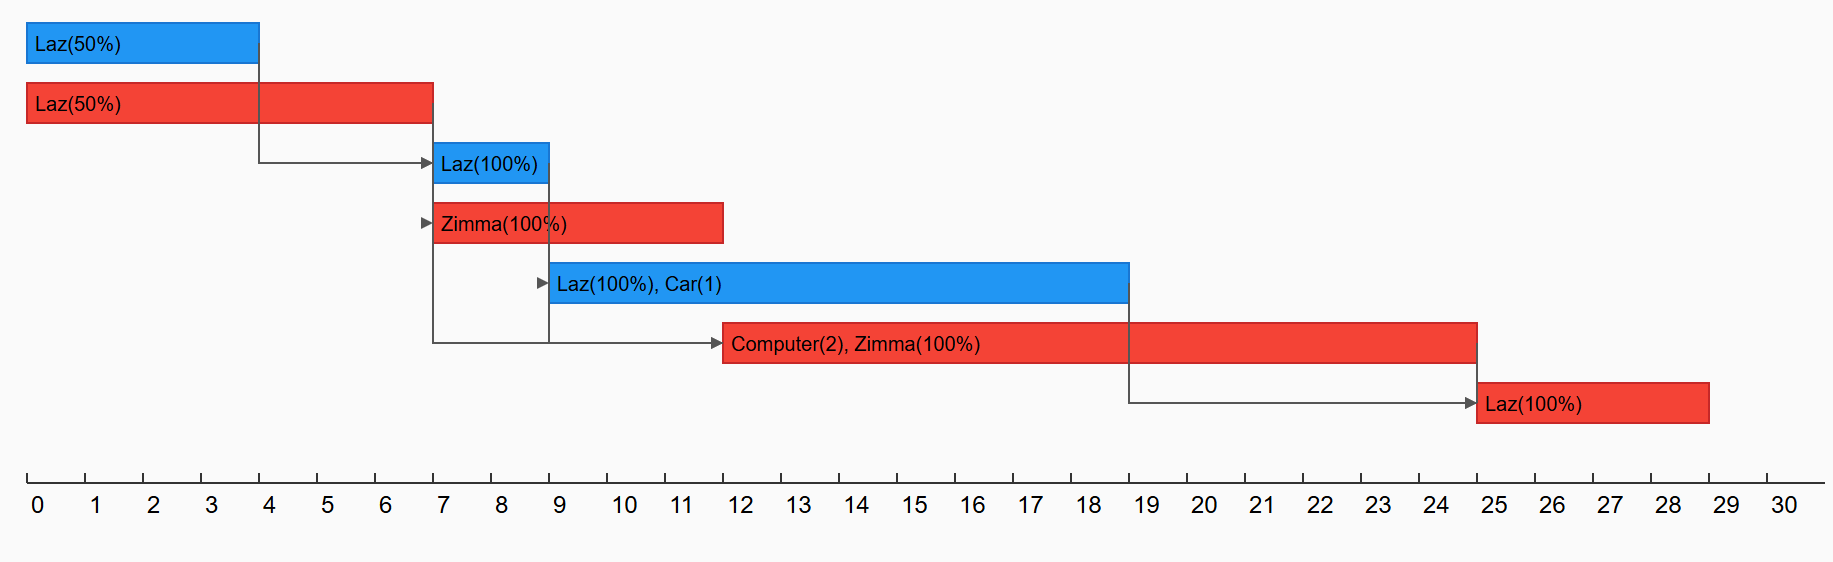
Allocate resources and generate an interactive Gantt.
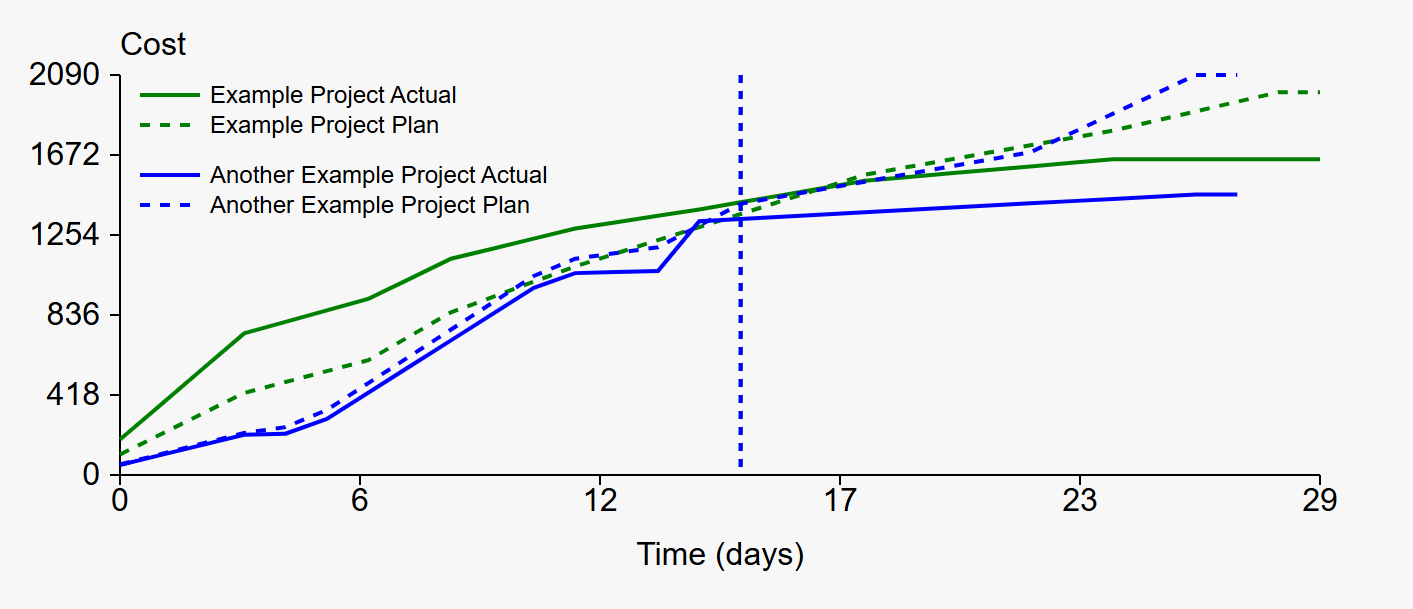
Compare performance and forecast with EVM.
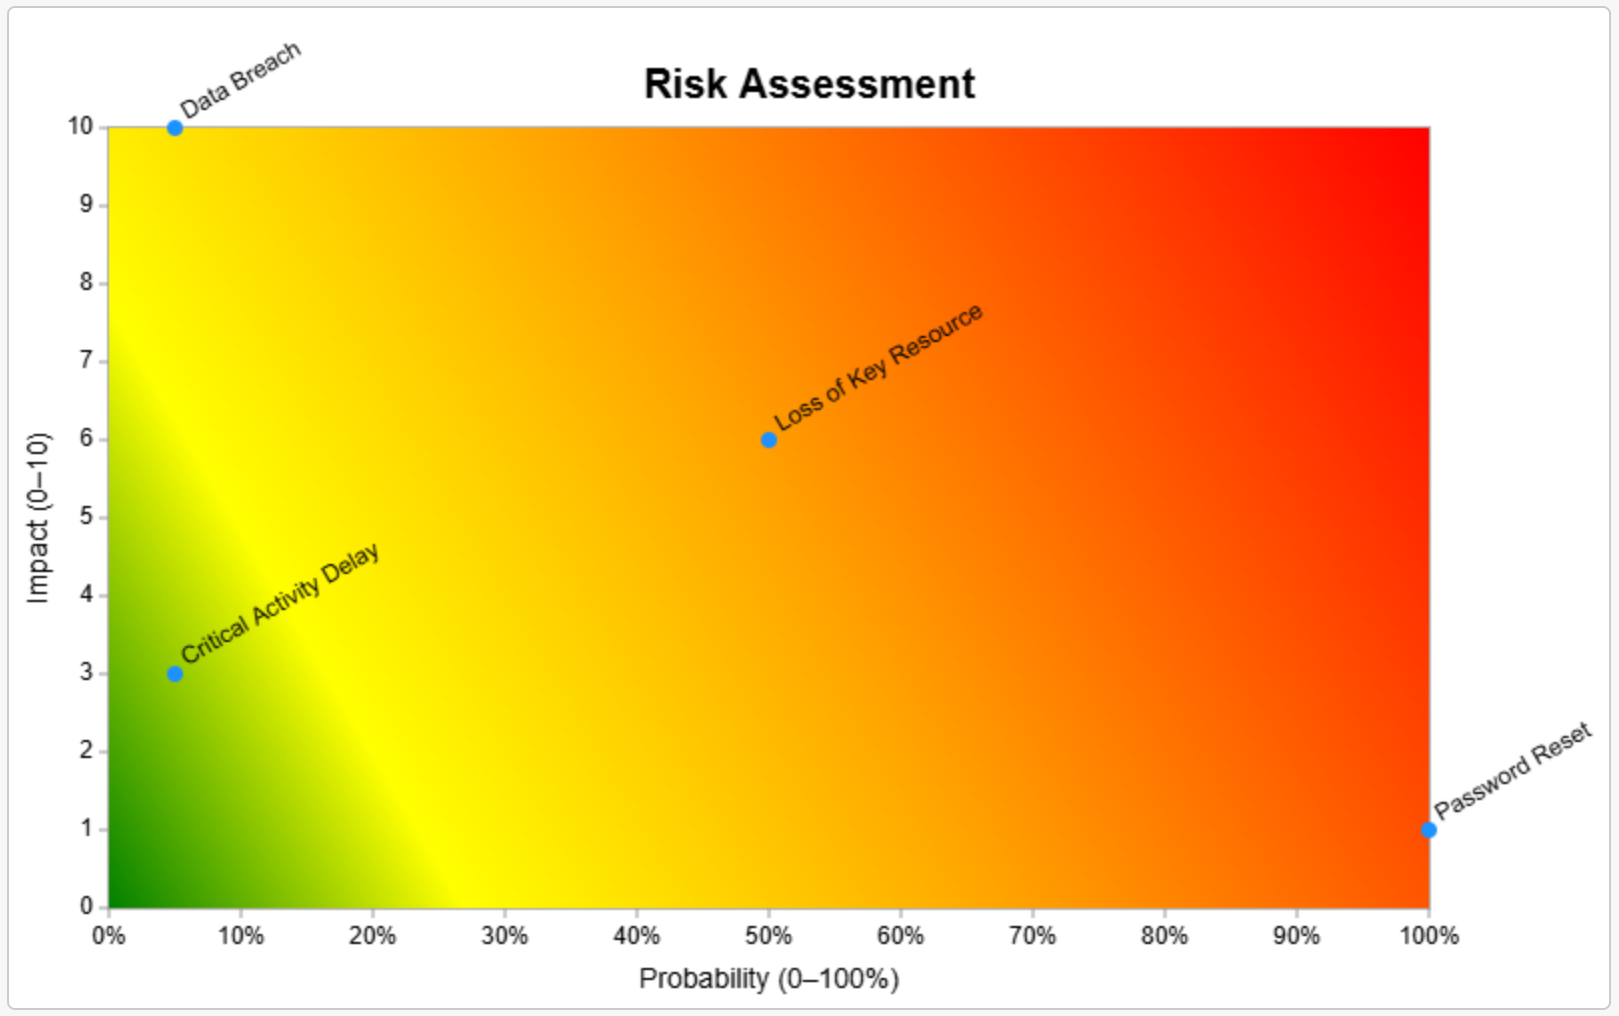
Identify, prioritize, and manage project risks.

Build risk charts with multiple variables.

Transform data into regression-ready Excel.

Fit distributions to your data and find correlations.
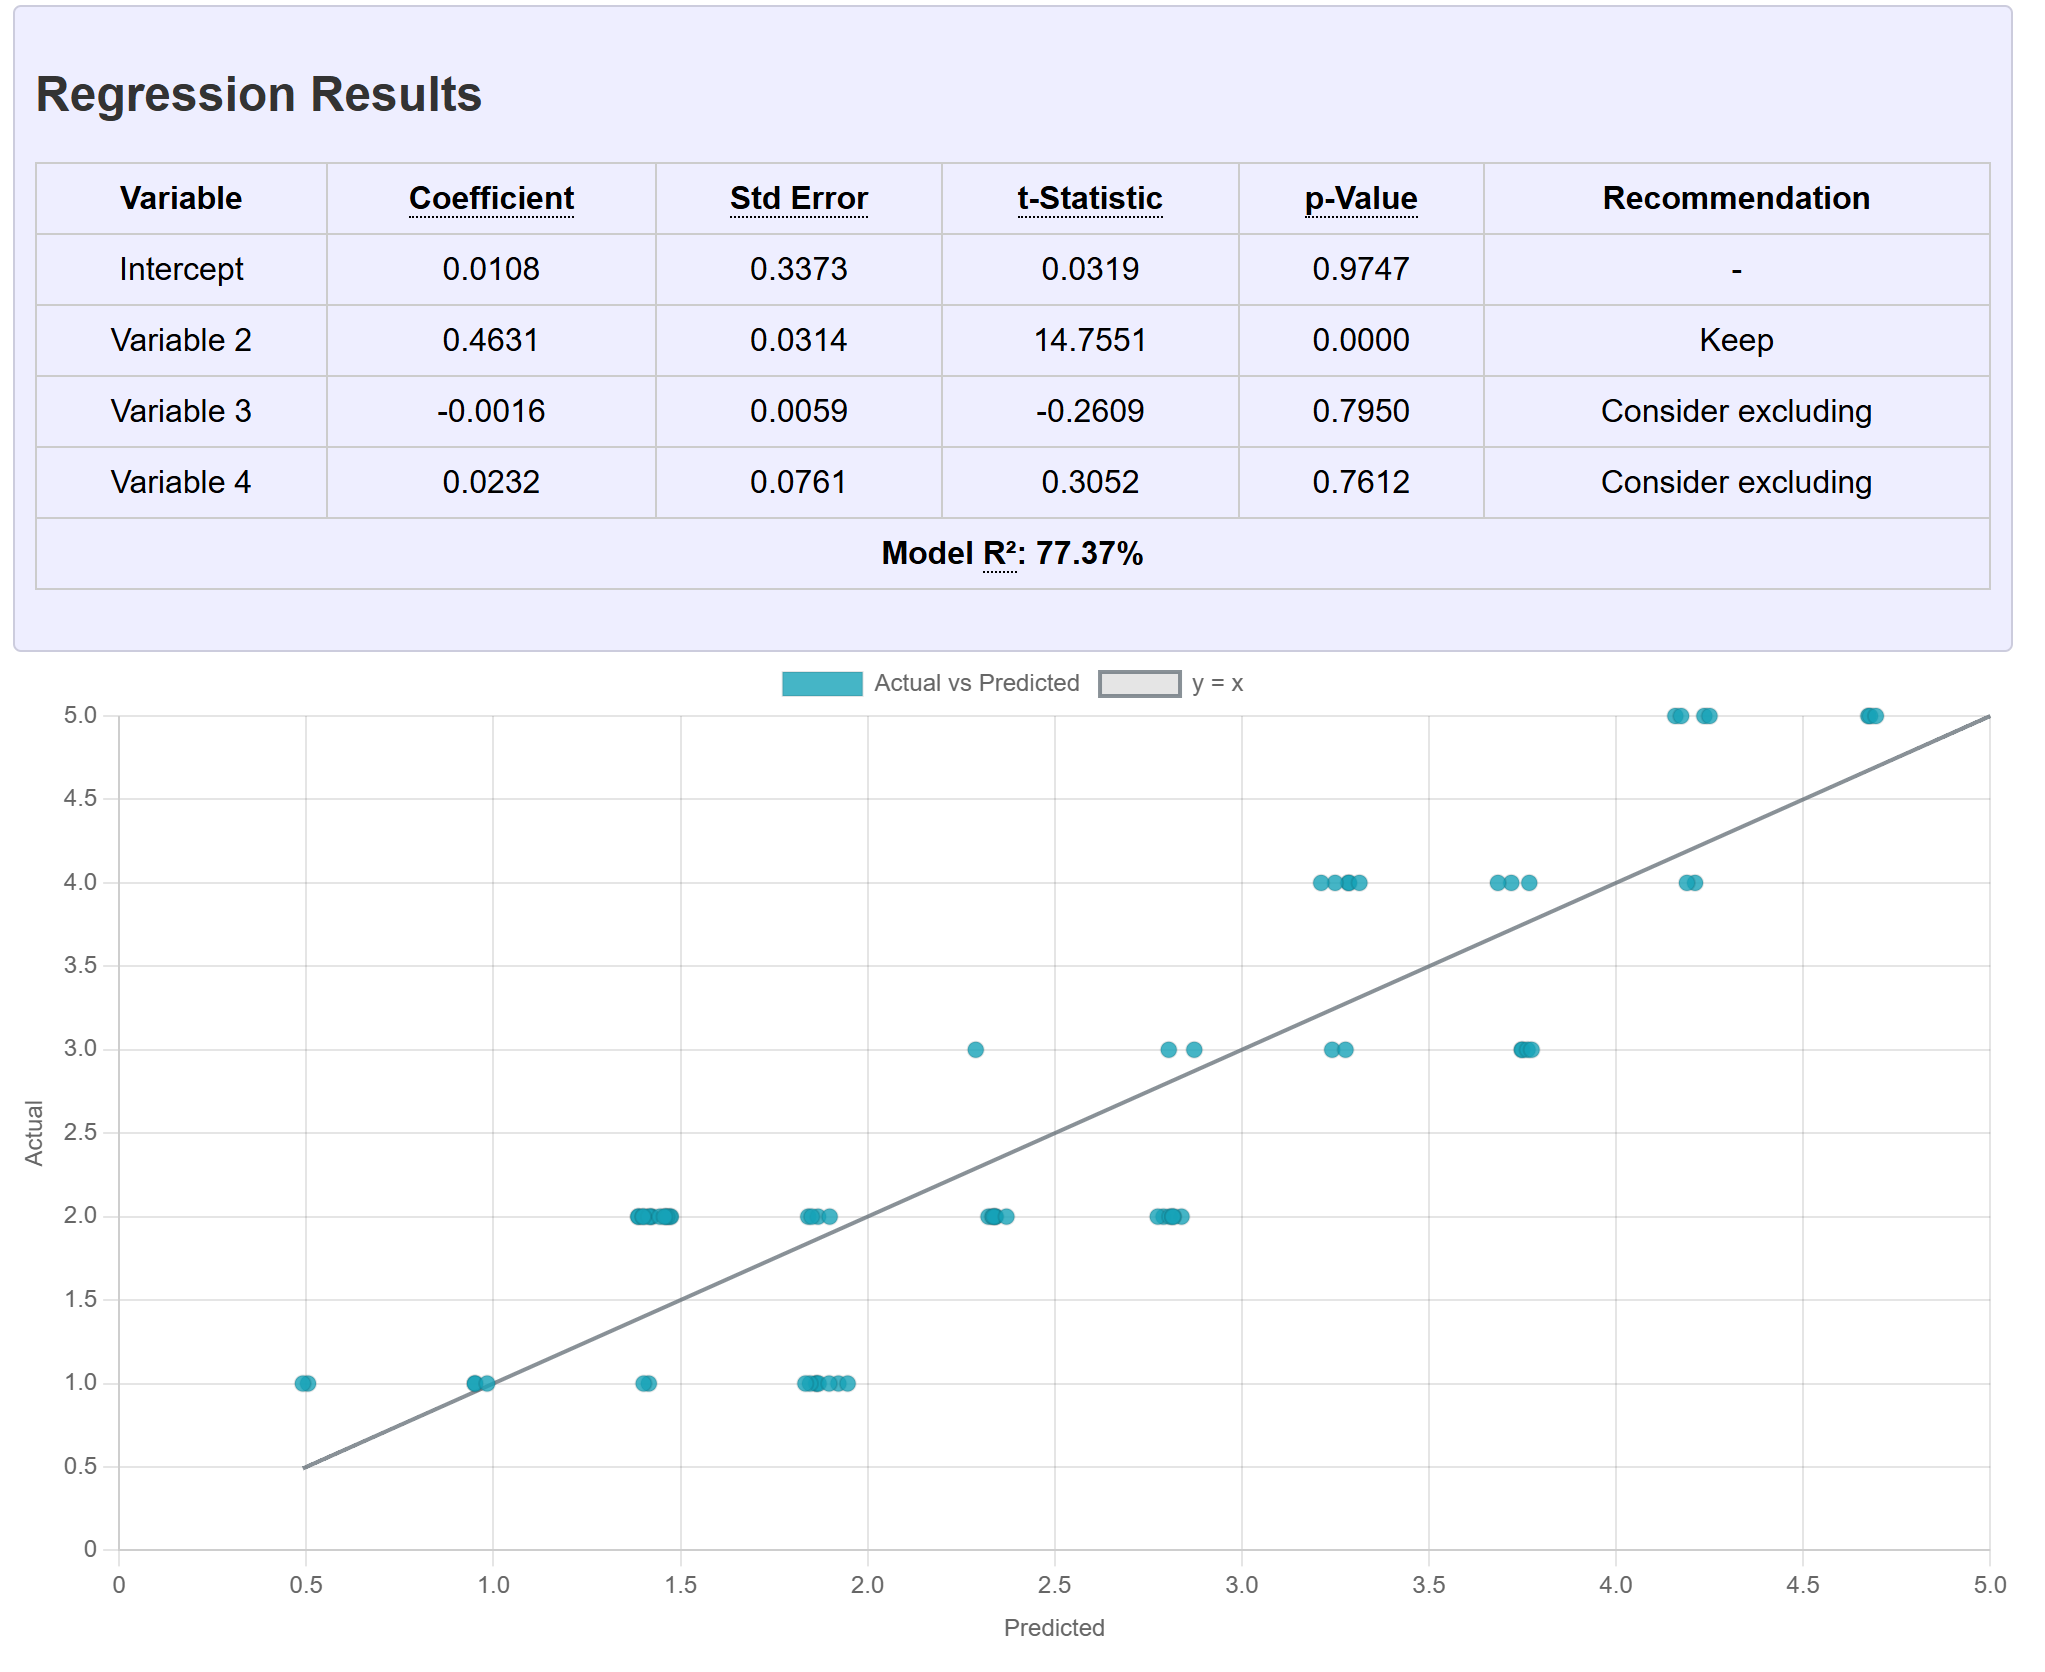
Predict with multiple linear predictors.
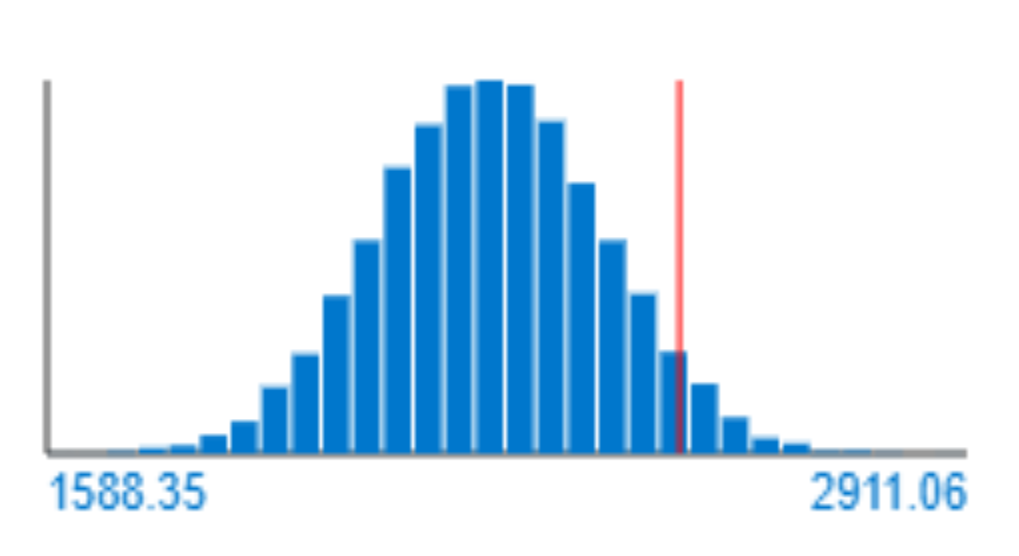
Predict outcomes based on uncertainty and risk.

Paste time-series data, run multiple forecast methods, and export results.

Conduct t-tests, z-tests, and ANOVA analyses.

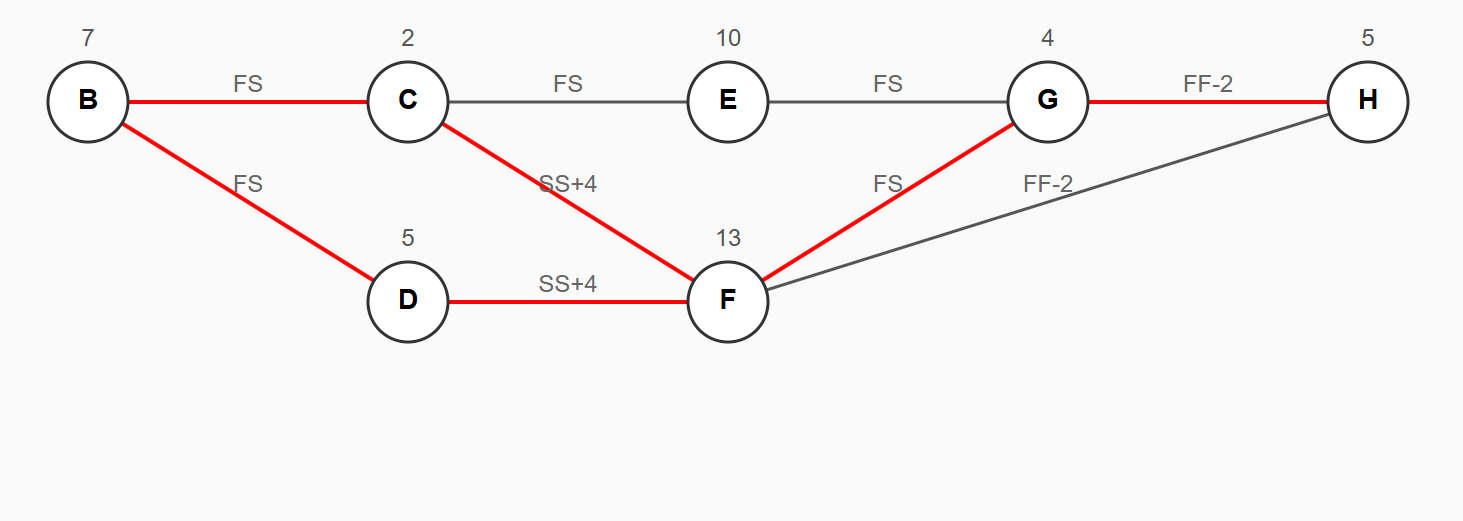
Analyze your project's critical path and schedule.
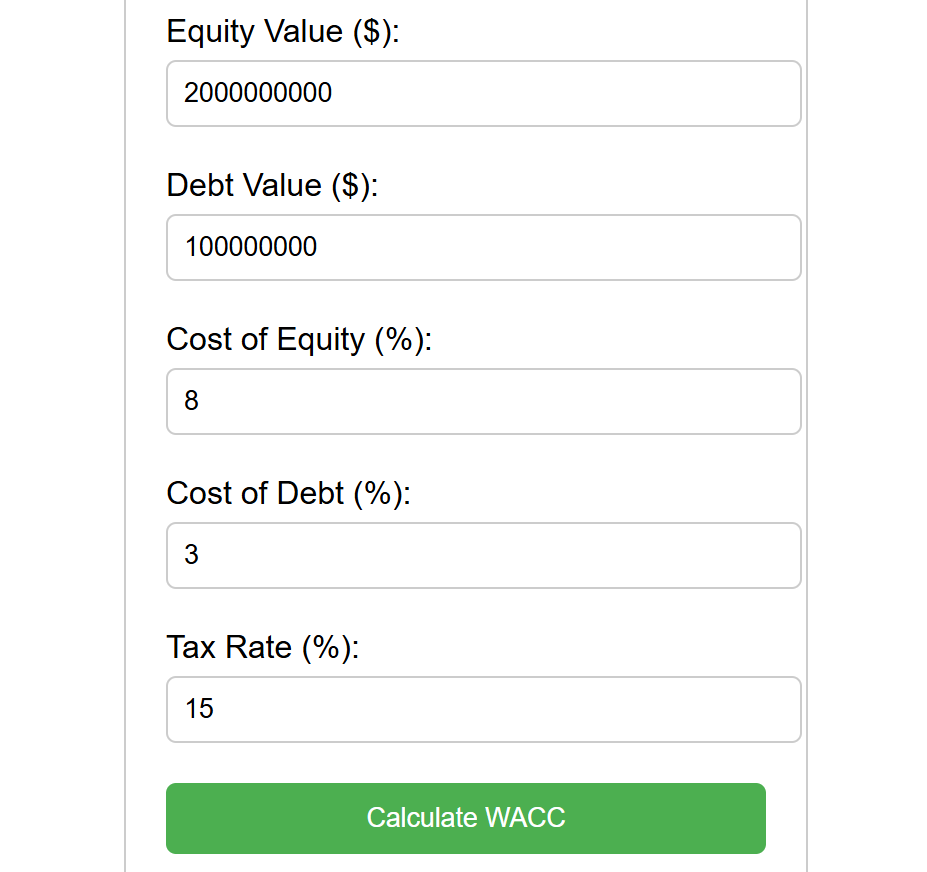
Evaluate PV, FV, IRR, and weighted averages.
Improve flow efficiency; spot bottlenecks.

Evaluate COAs with weighted criteria & probability branches, or build EMV trees by value & probability.

Compute Break-Even, Cost-Volume-Profit, and Activity-Based Costing.

Create control charts and analyze process capability.
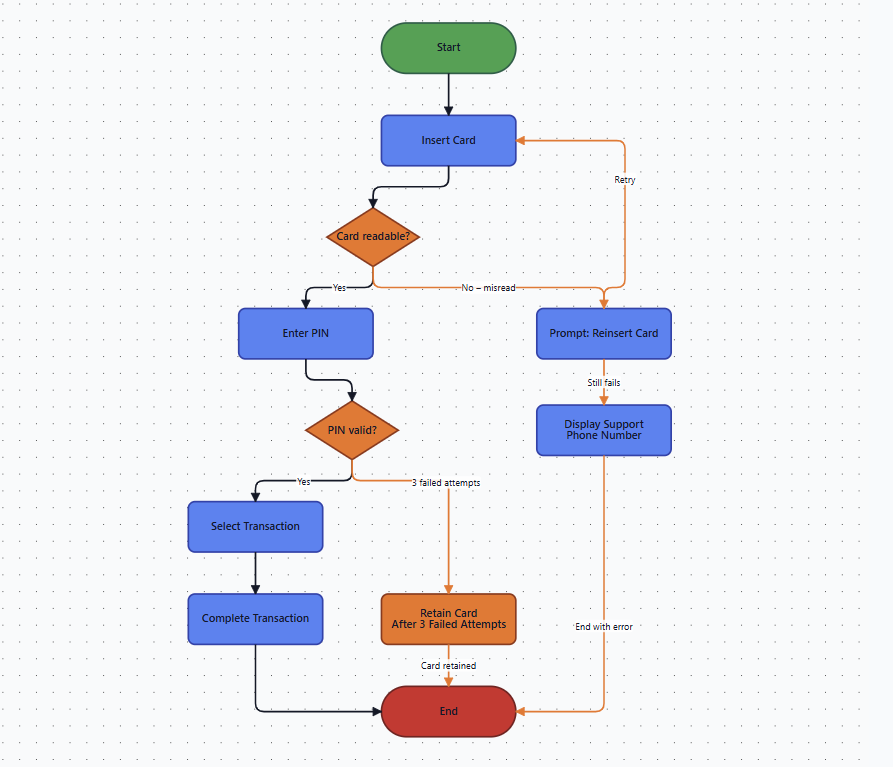
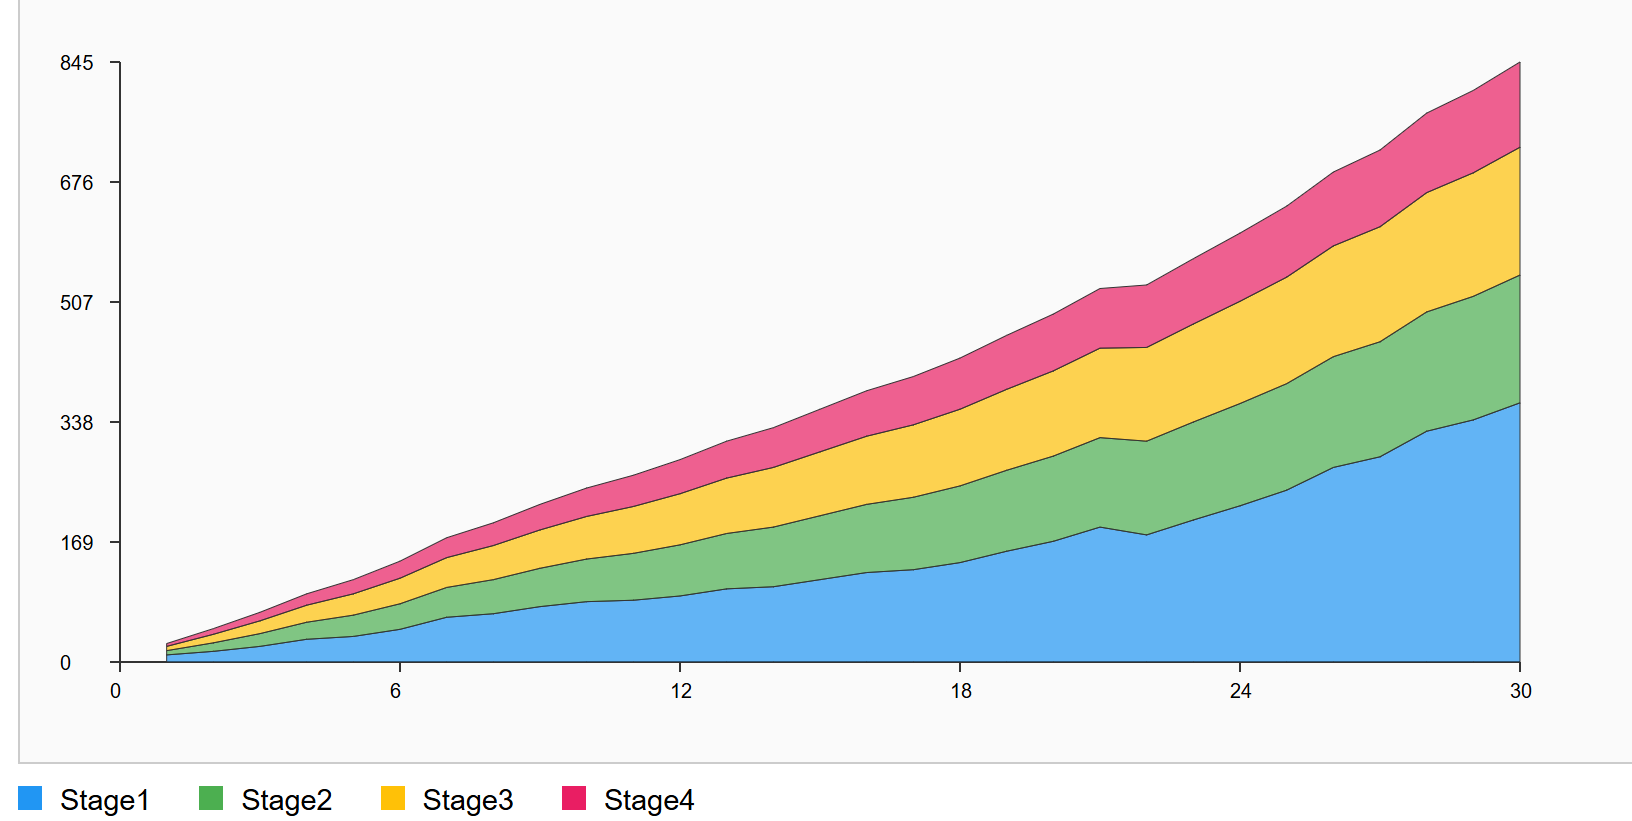
Design and export process flow charts.
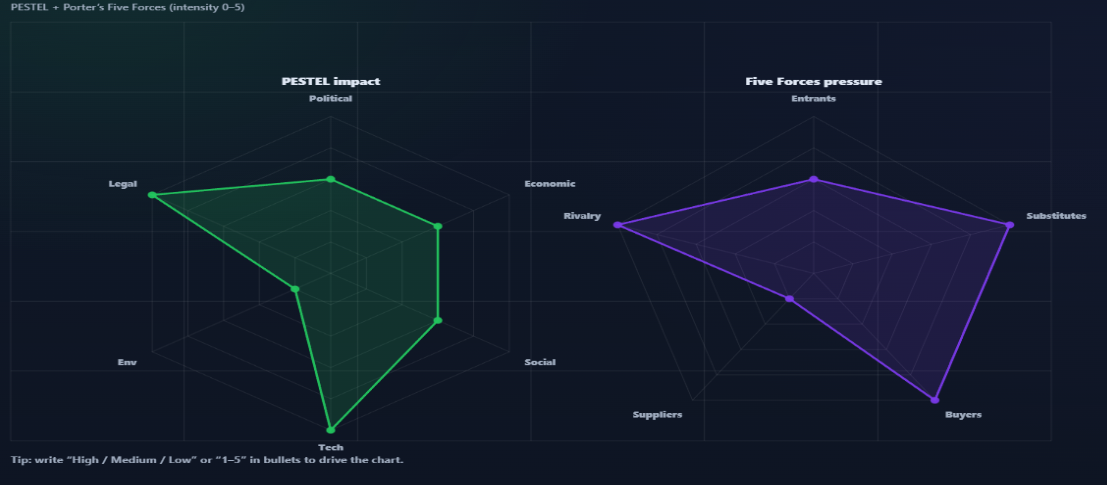
Perceptual maps, value curves, strategic groups, and SWOT/PESTEL.
Help us improve our tools. Share your ideas or user stories.
Leave Feedback